Asking mobility device users to come to a focus group or co-design event about transport tells the story of inaccessibility immediately. They need transport to get there. Even when it is possible, it is more inconvenient, difficult, and time consuming than for other transport users. So remote focus groups offer a solution.
The objective of the study was to pilot test an inclusive design approach to obtain information from users often excluded in the design process due to transportation challenges.

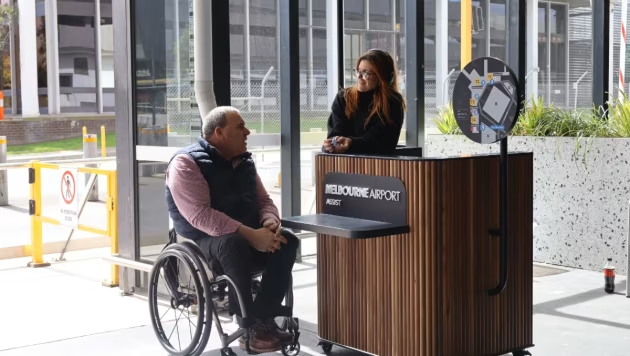
The remote focus group participants were users of wheeled mobility devices. The researchers devised a method that worked for users and for the research study. Nine users were each asked to participate in one of two different focus group sessions. One discussed 1 to 7 passenger vehicle transportation systems. The other discussed 8 to 12 passenger vehicle transportation systems. Each participant attended two sessions making four sessions in total.
Each participant was visible on Zoom in the same way as they would in a face to face discussion. However, being remote, they could remain anonymous by using a nickname or a fictitious name. This personalised the sessions and encouraged users to contribute. Video demonstrations of small (1-7 passengers) and midsized (8-12 passengers) vehicles were shown to users.
The researchers asked user’s preferences about various elements of the journey. They included planning, vehicle identification, boarding and alighting, and riding location.
Stable online connections are a must
All participants had access to the technology, but sometimes lack of robust connections happened through the sessions for some participants. This is a potential barrier for individuals who lack sufficient access to the necessary technology.

The researchers conclude that well-designed remote focus groups provide a powerful tool for inclusive and qualitative research. However, there is room to refine the methodology so that participation and data quality are improved.
The title of the article is Use of Remote Focus Groups to Improve Inclusive Design Practice.
From the abstract
This study examines the use of remote focus groups to obtain user’s ideas on wheeled mobility devices and Shared Autonomous Vehicles (SAVs). Inclusive design is essential for accessible transportation. Over four virtual sessions we collected statements from nine wheeled mobility device users. They told us about their design preferences, needs, and challenges with SAVs.
The findings highlighted the diverse needs and preferences of participants. This emphasises the importance of collecting information from users early in the design process. Well-planned remote focus groups can be an effective tool to gather design information from user populations that face transportation barriers.
Shared driverless vehicle design
A related research paper from the Intelligent Mobility Design Centre in the UK looks at engaging users in the design process. The key issue of the study is the preparedness to share vehicles on a broad scale.
The title is, Design for shared driverless vehicles of the future.
Abstract
On-demand shared transportation is a major new mobility innovation and potentially the main mode of transport in coming decades. Studies show that driverless vehicles have potential to accelerate uptake of shared vehicles at scale. People perceive sharing positively but do not necessarily translate perception into action, with desire for personal space a major reason for unwillingness to share vehicles.
Design research is a powerful tool when creating methods and processes to anticipate future possibilities by visualising detailed features of proposed products. We present a set of design research methods engaging end users in a variety of empathy activities and a design process to translate their needs into visual concepts for future shared driverless vehicles that are attractive and more likely to be adopted.