The policy push to encourage people to walk and use public transport is one way to reduce emissions and improve health. However, whether to choose the car or public transport, or not to go out at all, depends on many factors. So, do people choose the car because they are constrained from using other forms of transport? Or do they use the car because it just suits them better?
A review of the literature found that people with poor health, older age, low income and lack of access to a car are less likely to get out and about. Difficulties with public transport are linked with walking difficulties. So the design of the public transport system itself is not the total problem.
Some retirees might engage in several activities in one day making public transport a time consuming business. On the other hand, some retirees may only leave the house for medical appointments and grocery shopping. The paper based on the literature review goes into these issues in depth.
Some conclusions
Policies aimed at reducing car usage by older people with physical and mental impairments, must be approached with caution. Car mobility represents a crucial means of maintaining independence for older people.
The advantages of allowing older people to drive, despite minor disabilities, often outweigh the risks they may pose to themselves and others. It is noteworthy that France, togethr with the Netherlands and the UK, are nations with the most lenient procedures and minimal medical examination requirements for driving license renewal. However, these countries also report the lowest fatality rates for car drivers within this age group.
The links between mobility, safety, and older people shows that people aged over 65 are considerably more vulnerable to fatal incidents as pedestrians than as drivers. So there is an intricate balance between considering the mobility needs and safety of the older drivers and pedestrians.
Universal design helps
Researchers found that physical difficulties are contextual, and decrease when universal design measures are taken. Universal design is not a luxury for a few individuals. Physical accessibility helps a lot a people to move around more smoothly and comfortably.
In a nutshell: the motor car becomes a mobility device as people age and walking becomes more difficult.
From the abstract
Our research challenges the prevailing notion that immobility only occurs in exceptional circumstances. Our work shows instead a close link with individuals’ activity levels and constraints on their schedules.
Retirees and non-working population groups exhibit higher immobility levels than workers. This is influenced by factors such as poor health, old age, low income, lack of access to a car, or rural residency.
Driving and walking difficulties are significant contributors to immobility, with age being a primary explanatory factor. However, living in dense urban areas tends to reduce immobility levels across household categories. Difficulties with public transport, as such, do not trigger immobility, but they are entangled with walking difficulties.
Implications for public action include targeting age-specific interventions for reducing car dependency, and approaching policies aimed at curbing car use by older people cautiously.
Implementing universal design measures to enhance physical accessibility also helps to make mobility smoother and decrease perceived walking difficulties. Finally, this paper underlines the interconnectedness of mobility, social isolation, and sedentary lifestyles.
Is the driveway to the shopping centre carpark part of the road or is it part of the footpath? Most people – motorists and pedestrians – don’t realise that driveways are part of the footpath. And what about crossing side streets adjoining main roads? Who should give way to whom?
Sometimes it’s difficult to tell because the visual cues are confusing. If the footpath section has a steep camber towards the roadway it looks like the road. And sometimes there are hazard warning tactile markers where the driveway goes over the footpath. So it looks like the road. Also, the colour of the driveway is often different to the adjoining footpath.
Augustus Brown discusses the issues in his article about continuous footpaths at driveways and side streets. Drivers crossing the footpath to or from a driveway must give way to people walking. Drivers must also give way to people crossing the road when turning at intersections.
To highlight the priority for people walking, footpaths should be designed to give a clear visual cue that drivers need to slow and give way.
Image from the article
Design principles of continuous footpaths
Footpaths should be visually uninterrupted at the crossing point
Footpath pavement material should be consistent
Footpath pavement should remain level at the crossing
Narrow kerb ramps should lift crossing vehicles to the height of the footpath
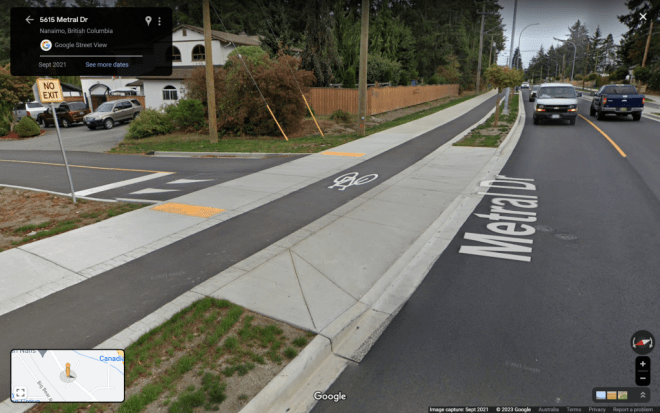
Images from the article
Clearly marked continuous footpaths and cycle lanes give priority to both cyclists and pedestrians.
Brown’s article has several examples of well designed treatments of footpaths across driveways and side streets and some drawings with more information. The title of the article is, Continuous Footpaths at Driveways & Side Streets.
Public transport infrastructure in Queensland is undergoing significant design changes using co-design methods. The new Cross River Rail project embraced the concept of co-design to ensure new and upgraded infrastructure is fully accessible. The result is a transport infrastructure co-design toolkit as well as accessible trains and stations.
Co-design of large-scale public transport infrastructure spans several stages in the design process. Consequently, embedding a culture of co-design across the organisation is essential in the planning, development and implementation stages.
Image from the Toolkit
The authority responsible for the project collaborated with the disability community and established strategic priorities to support ongoing infrastructure design.
Accessibility agenda
First there needs to be an accessibility agenda – finding out the diversity of accessibility challenges. That means establishing ways of working with the disability sector to drive decision making. However, there is a risk that some of these priorities disappear in pre-project activities such as feasibility studies and technical requirements. Some decisions made at these stages cannot be changed as they lock in key aspects of the design.
A culture of accessibility
An organisation-wide culture of accessibility is essential for the success of projects. Without this culture change the potential for “gaps” in the travel chain will arise for travellers. Sharing information across the different transport organisations and contractors and consultants is a must. By consolidating the knowledge base across the sector, it eventually gets easier to create inclusive public transport projects.
The title of the Toolkit is, Embedding Accessibility Co-design into the Delivery of Public Transport Infrastructure. The document is the result of research collaboration between the Hopkins Centre and the Cross River Rail Delivery Authority. The outcome has established a clear set of priorities for continued support of changes including those already underway. They key element is co-design with the disability community.
Toolkit contents
There are three parts to the document: Context and background, Outline of the co-design process, and Facilitating the co-design process. The appendices have extra detail and additional resources.
The Appendix on co-design mindsets appears to follow the theory of the once popular Myers-Briggs Type Indicator. Nevertheless it does indicate that different people think differently – a concept aligned with Universal Design for Learning. It means people should be given the opportunity to express their thoughts in different ways.
The video below gives an overview and showcases some of the innovations in design. For more about accessibility, visit the Cross River Rail website where there are more videos with transcripts.
Research by Guide Dogs NSW/ACT reveals there are new footpath and urban design challenges faced by people with low vision or blindness. The research is part of a longitudinal study to understand what environmental and footpath clues are needed and used. Tactile indicators are only part of the story even when they are present and properly placed.
A total of 622 people with low vision or blindness from around Australia took part in the survey. Many challenges impact their confidence in getting out and about. New-style urban design features are creating additional challenges.
The first survey was conducted in 2015. The 2023 survey revealed new challenges not mentioned in the earlier survey. Micro-mobility, shared paths, shared roads, and crowd protection barriers are now on the list of challenges.
Shared paths
The application of shared paths has increased significantly since 2015. Consequently, this emerged as a major issue in 2023. The speed and unpredictability of cyclists and micro-mobility users means these paths feel unsafe.
Flush finishes
Another new and popular urban design feature is flush finishes. Not surprisingly, 80% of respondents lacked confidence in crossing roads when the footpath and road were at the same level. Places where the road and footpath are level are often found in shared zones and flush finish intersections. Respondents over the age of 65 find these finishes particularly unsafe.
The absence of clear distinctions and continuous finishes hinder straight-line navigation. This is made worse by street furniture, goods displays and outdoor dining positioned along the building line.
Flush finishes at intersections with traffic lights where there are no gutters, kerbs or kerb ramps are a significant challenge. With multiple lanes of traffic in both directions, together with buses and light rail, create high levels of anxiety for safety. Consequently, they are often avoided.
Wayfinding
Key wayfinding factors for safe travel are based on maintaining a straight path, safe road crossings, and knowing where it safe and hazardous. This is regardless of whether the person is using a cane, a guide dog or their remaining sight.
Kerb ramps are vital markers. People who are blind or have low vision know to pause and assess the situation. They also reinforce appropriate guide dog behaviour when approaching roads.
Read more about this research in an article in Access Insight. It’s titled, Environmental clues: Using them and losing them. The article explains why newer street and urban design features are preventing people with low vision or blindness from equitable use of our public domain.
From a universal design perspective, many design features that are essential for some, are also good for others. Children are taught to stop at kerbs for safety, and older people prefer clear separation between footpaths and other zones. People with neurodiverse conditions, including dementia, also need clear signals to navigate the built environment.
Walking is supposed to be good for us, but not if street design causes anxiety and prevents people from making journeys.
Tactile markers vs wheelchairs: A solution?
One paper that sparked a lot of interest at the UDHEIT conference is the thorny issue of pedestrians and wheelchair users negotiating those yellow strips of tactile markers. Tactile markers, known as Braille Blocks in Japan, cause problems for wheelchair users, pram pushers, and others with mobility difficulties.
Based on research by Yoshito Dobashi in the context of public transportation, the solution seems simple. Create small breaks in the line of tactile blocks to make wheelchair and baby buggy crossing points. These crossing points are now installed in Fukuoka city and in some airports, but not yet on a national scale.
Dobashi cautions that, “…improvements need to be made in response to the voices of visually disabled persons who note that the crossing points pose a hazard to them. In his latest study, Dr. Ito of the University of Tokyo proposes a new braille block system that incorporates an improved version of braille blocks with wheelchair crossing points upon verifying its feasibility with wheelchair users and baby buggy users.
Good research paper by a man passionate for his topic and keen to find solutions. The image shows Dobashi presenting at the universal design conference in 2018 in Dublin.
The article is from the open access proceedings of the UDHEIT 2018 conference held in Dublin, Ireland, an open access publication.
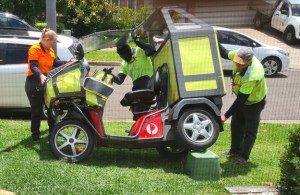
Roadblocks to inclusive streets
Mail delivery vehicle crashes into an electrical services box. Note no footpath only grass.
Streets are essential to mobility and that means pedestrians, not just motor vehicles. Dangerous intersections, pedestrian crossings, steep kerb ramps and those utility vaults make wheeling a nightmare. Steve Wright says that universal design is what we should be aiming for. That’s because there are a hundred ways a street can deny mobility to a wheelchair user. And if they deny a wheelchair user, they can deny people unsteady on their feet and make pushing a stroller difficult. Wright lists his top 8 roadblocks to inclusive streets.
8 Roadblocks to inclusive streets
Narrow footpaths: If two wheelchairs or two strollers cannot pass each other than it is too narrow. Many footpaths don’t even accommodate two people walking side by side. Even where a footpath has sufficient width, there can be other obstructions.
Too many stakeholders: Several agencies have a stake in the footpath – hence the many access covers scattered throughout the paving. And then there is street furniture and rubbish bins.
Crappy kerb ramp: Problems often arise where a steep ramp into the gutter meets a steep rise onto the roadway. The deep V means wheeled mobility devices get stuck half way. Then there is the kerb ramp set on a corner that means people have to roll into oncoming traffic. And of course, there are kerb ramps which don’t line up to create a straight line across the roadway.
Traffic calming islands and safe havens: These must be at least wide enough to take a mobility scooter and an adult pushing a stroller. And not everyone can cross a wide street quickly. Mid-way points are a must if traffic takes priority.
Cross slopes and cambers: Narrow streets also mean that driveways and kerb ramps cut into the footpath creating cross-falls that are difficult for wheeled mobility users.
Footpath closures: Construction projects seem to be blissfully unaware of the havoc they create with their “no pedestrians” or “pedestrians this way” signs. And some of these are not just for a day – they can be for years.
Pedestrian crossing buttons out of reach: While the button might technically be at the right height, sometimes the pole it’s on isn’t within reach.
Transportation decision makers don’t have a disability: Transportation projects go to contractors and subcontractors with many other stakeholders involved. They would do well to embrace some co-design methods.
Wright discusses the issues in more detail from a US perspective. He says: “Universal design is what we should be aiming for, but there are 100 ways that even the most well-intended complete street can deny mobility to wheelchair users due to poor design, implementation, maintenance, and even policy.”
Making walking and wheeling more inclusive is the aim of the Walking for Everyone Guide. At 122 pages the online guide sets an ambitious and inclusive agenda for the future of walking across diverse communities. Community-led engagement is important to ensure changes meet the needs of residents. This is how you get local place-based needs met – there is no one-size-fits all.
Walking is often ignored in transport policy. Even when it is, the budget allocation takes it from the top of the hierarchy to the bottom. Consequently, basic elements like footpaths are not delivered. Despite almost every journey beginning and ending with walking and wheeling, streets are not inclusive.
Valuing and promoting lived experience enables transport planners to understand different experiences especially where they conflict. The Guide reminds us that solutions will sometimes require compromise, but marginalised groups should come first. After all, their needs will improve experiences for other walkers.
The Guide presents a framework of recommendations targeted national and local governments. There are three key themes:
Improving governance, planning and decision making
Creating better places for everyone to walk and wheel
Supporting everyone to walk and wheel
Each of the themes is dealt with in detail. In Theme 2, Creating better places, they tackle road safety, air quality and physical severance by roads. In the UK, cars are allowed to partially park on the footpath in narrow streets, but Living Streets recommend this practice end. This is because it often limits the movement of people using assistive mobility devices.
Close the mobility gap
A key point in Theme 3 is to close the mobility gap by making walking and wheeling inclusive. This includes ensuring everyone who needs a mobility device can get one. These devices include assistance dogs, personal assistants and support workers as well as equipment.
The Guide is well presented with attractive photographs depicting a diverse population of pedestrians. It includes a socio-economic context and next steps which is a call to action for government, business and community sectors to work together. There is a useful list of reference documents at the end.
Living Streets Scotland also has a useful Tools for Inclusion publication. This one is a guide on devising an Equality Impact Assessment at local government level. The report looks at the use of Equality Impact Assessment in delivering the obligations of the public sector to address the inclusion of people with disability. The findings of their study show there is still a long way to go. The report has several useful recommendations.
Infrastructure for everyone
Queensland’s Department of Transport and Main Roads (TMR) commissioned a project to map walking infrastructure for people with disability. The aim was to collect information to help planners create footpaths and crossings for everyone. “Walking” includes people using a mobility device such as a cane, frame or wheelchair.
The mapping project collected data from wheelchair users using technology to assess footpath surface, effort to push, barriers and kerb ramps. The technology also collected data on shade and signage.
“People with disability can be left stranded by a missing section of footpath or kerb ramps. Providing infrastructure suitable for people with disability means everyone benefits: people with prams, children, people with an injury, older people and anyone who wants to walk beside someone else comfortably.”
TMR’s Action Plan for Walkingis part of their plan for walkable communities and places. Other parts of the Plan are Walking for Transport, and Greening Streets. Mapping the best routes for walking was another project. The aim was to identify the best routes for walking to and from important places such as public transport and shops.
As a result of these mapping exercises, TMR funded network walking plans for 11 places in south-east and northern Queensland. The plans include works programs that have actions to make the network a reality. These include building missing footpaths and convenient crossings.
The 2 minute video below explains how the mapping technology works. Three key aspects were identified, effort, connectivity and the risk presented with the network.
Access and inclusion for transport in Queensland
Different government departments are responsible for different aspects of transport services and infrastructure. Consequently, not only do we “mind the gap” at the platform, we have to mind the gaps elsewhere in the system. And these gaps are sometimes just too wide for some people with disability. Queensland’s department of Transport and Main Roads seeks to overcome these gaps with their Access and Inclusion Strategy.
Queensland is a popular tourist destination and accessible tourism needs accessible travel to support this sector. Queensland is also hosting the 2032 Olympic and Paralympic Games and this has provided an extra reason to get things right.
The Access and Inclusion Strategy aims to create a single integrated network accessible to everyone. The Strategy was developed in consultation with customers, employees and partners, and it covers services, products, information and infrastructure.
The Accessibility and Inclusion Plan 2023-2024 supports the Accessibility and Inclusion Strategy. The Plan has 27 actions across three key pillars: strategy, culture and process.
The web pagesfor the Strategy and the Plan have a summary and links to alternative formats of the documents including Auslan and a narrated version. There are alternative language summaries and video transcripts as well.
The UK has an ambitious target that 50% of journeys are walked or cycled by 2030. However, for some groups the quality of footpaths is a major deterrent to walking. According to a Living Streets report, 48% of older adults say they would walk more if footpaths were better maintained. Their fear of slips, trips and falls is enough to put them off. And there is a health cost for this – not just the falls, but the lack of incidental exercise.
The number of trips and falls due to poor footpath maintenance is difficult to establish due to lack of data. Living Streets has done their best to gather what information there is to find out the state of play.
Hospital admissions and insurance claims are two obvious sources of information, but even this is patchy.
Pedestrian falls happen to people of all ages, but as people age they are more likely to fall and to sustain an injury. As a consequence they are more likely to find themselves in institutional care.
One finding is that the number of hospital admissions from pedestrian falls was three times the number from pedestrian-vehicle crashes. So, if we had better data on pedestrian falls, it could change the priorities for road maintenance spending.
The Living Streets report uses 10 observational case studies to gather more information on footpaths and falls. In the UK vehicles are allowed to park over kerbs onto the footpath. This not only blocks the path of travel, it degrades the quality of the footpath. Local authorities had different ways for people to lodge complaints about footpath maintenance.
Can things be improved?
The bottom line is that budgets decide priorities, but whose budget? In the UK, falls cost the national health service more than $2.3b per year. This figure is set to rise as the population ages. However, the focus of this cost is falls indoors and unreported falls outdoors is still a problem. Using proxy figures, Living Streets estimates there could be more than one million outdoor falls among older adults each year.
The role of road strategies and plans
In the UK, the Highways Asset Management Plan allows for local authorities to claim they they taken reasonable care to make sure the road was not dangerous to pedestrians. Is this still valid in 2024? The focus on the cost to highways is not accounted for in the cost of hospital and social home-based care. Both these costs are borne by local authorities yet there is no connection between the two.
Lucinda Miller asks the same questions any follower of universal design and inclusive practice asks. “Who are our built environments planned for?” Disability access standards are framed around people with physical and sensory disabilities. But what about people with invisible disabilities? Miller puts a neurodivergent lens on public transport and challenges the way policies are ‘decorated’ with the language of access and inclusion.
“What does ‘public’ mean if it does not serve the needs of all people in the community?”
Creating inclusive environments is not only bricks and mortar, but also the belief systems held by society.
Cover image by Miller and Leddie
Miller highlights the gap between the words and deeds in policy documents. There is a chasm in the translation of access and inclusion in addressing invisible disabilities.
The thesis reviews both disability literature and policies and looks at ethical considerations. New South Wales state and local government policy is the basis of the policy review.
The diversity of lived experience must be baked into the design recipe – the planning instruments – rather than bolted on as an afterthought.
Discussion and recommendations
The Disability Discrimination Act and the Disability Transport Standards define disability as both mind and body, but are skewed towards physical disabilities. These documents guide planning instruments and so the diversity of invisible disabilities goes unrecognised in action plans. Consequently, environments are accessible to some, but not inclusive of everyone.
Recommendations include mandating hidden disability training and taking a whole-of-government approach to universal design. A universal design approach should be at everyone stage of projects and include people with lived experience.
“This thesis explored how terminology such as accessibility and inclusive in policy and urban design translate to public transport from neurodivergent perspectives. It revealed that accessibility currently equates to a compliance-based mindset favouring minimum design standards. In contrast, inclusive is less concrete and highly decorated in strategic documents, yet its translation is absent from public space.”
From the abstract
Designing public transport to accommodate people with physical disabilities has gained momentum. The consideration of invisible disabilities, the experiences of neurodivergent individuals, navigating public space is yet to catch up.
This thesis interrogates the terms ‘accessibility’ and ‘inclusive’ in transport planning, and examines how these terms translate to the built environment.
This thesis emphasises the social value of public services in its fundamental role in serving communities. Despite the importance of compliance-based thinking there is a need for a cultural shift that moves beyond minimum standards..
The diversity of lived experiences should be embedded in planning instruments – “baked in, not bolted on”. It accentuates the Transport ‘Customer’ as more than a transactional member of the community.
The design of public transport must reflect the spectrum of disability, where transport journeys are about dignity. All users and their intersecting needs should feel a sense of autonomy over their right to participate in everyday life.
The design of driveways and their impact on footways is often forgotten in street design. That’s because not many people realise that crossing over driveways and roadways at side streets to continue a journey is part of a footway. Consequently, the design of continuous footways has a role to play in creating walkable neighbourhoods.
Living Streets is a UK based charity focused on safe and accessible walking and wheeling. As part of a major project to encourage walking they have produced a report on inclusive design and continuous footways.
The research project included a literature review, GIS mapping, working with professionals, working with people with disability, which led to detailed site work. The issues raised in this project are likely to be similar in other jurisdictions.
Key conclusions are:
There’s confusion over what constitutes a continuous footway, their design, and what their use aims to achieve
Many designs being called continuous footways in Britain do not convincingly continue the footway
Most of the designs called continuous footways in Britain do not provide high levels of pedestrian priority
The use of these designs can create problems not just for some disabled people, but for a wider group
Where there are fewer vehicles travelling at lower speeds, it’s easier to establish pedestrian priority
What we call “real” continuous footways might be more effective in prioritising pedestrians
Many pedestrians find crossing over delivery driveways and car parking driveways unsafe. This is largely due to drivers and pedestrians not knowing who has the right of way.
Design issues
Researchers found that some designers wanted to design for maximum pedestrian safety, but were forced to compromise by “highway engineers”. People who are blind or have low vision are particularly impacted where the footway is not clearly delineated by kerbs or clear transitions. This results in that journeys not made when pedestrians feel unsafe.
Design factors having potential significance for pedestrians are:
Continuity of main carriageway kerb
Lack of visible (kerb) radii at the main carriageway
Continuity of markings (white line)
Height different and ramp design
Visual continuity of materials and colour of footway
Contrast between footway and carriageway colour
Findings from the study
Overall there was a broad failure to prioritise pedestrians at all study sites even where designers were aiming to prioritise pedestrians. Failure to reduce vehicle speeds and use visual cues so that drivers know when they are crossing a footway were two findings.
Living Streets has an additional literature review on continuous footways which is part of the Inclusive Design at Bus Stops and Continuous Footways project. The overall project is to investigate issues for both continuous footways and cycle tracks at bus stops.
One of the findings is that guidance documents suggest benefits for either pedestrians or cyclists but not both. The broader Living Streets project is investigating whether continuous footways can improve the inclusivity of streets. Continuous footways can include raised crossings which gives a physical signal to drivers and cyclists that pedestrians have priority. However, people who are blind or have low vision require consistent application of tactile ground indicators to make this work for everyone.
This is a thorough review of the literature with more to come. You might need to sign up to Living Streets to access their free material.
Most of the research and about accessible transport focuses on people with physical and sensory disabilities. But people with anxiety conditions experience mobility challenges as well. Consequently, they adapt or restrict their movements to minimise anxiety triggers. Sometimes the trigger can begin before leaving home when information about the trip is lacking or inadequate.
Not much is known about the travel behaviours of people with anxiety conditions, but they are complex and varied. However, active travel in familiar surroundings lessens the impact on their anxiety.
People with anxiety disorders can be restricted in their mobility because of their concern about having an anxiety attack away from home. This can be as a driver or passenger in a car, travelling by public transport and even going on foot.
Anxiety disorders take many forms: panic attacks, fear of open spaces, fear of social embarrassment, and specific phobias such as fear of dogs. The researchers look at these and related cognitive conditions as well as different modes of transport triggering anxiety.
It’s complicated
While some reduced their anxiety triggers by driving a car, others experienced higher levels of anxiety as a driver. That also means that for some, catching a bus is preferable, while for others this raises anxiety levels. One of the key factors is the sense of being in control of their situation. Anxiety levels for most interviewees are increased when more than one travel mode is needed
Staying in familiar environments was an important coping strategy for most interviewees. Travelling with a family member of friend also helped. Taking a universal design approach to make transport systems, information and infrastructure can help mitigate anxiety levels. Knowing what to expect and when provides a the necessary sense of control.
Co-design processes should include people with anxiety disorders as well as people with physical and sensory disabilities.
From the abstract
People with anxiety disorders may encounter anxiety triggers when (planning to) travel(ing) to a destination. This affects their ability to actively participate in society.
In-depth interviews were held with 40 Dutch adults which revealed that most interviewees experience a mix of problems in using various transport modes. Interviewees often experience the feeling of being locked up and not being able to escape as anxiety triggers. They perceive the mobility system as complex and overwhelming, while mobility-related information can trigger panic attacks or lower respondents’ stress level.
Coping mechanisms include: avoidance of transport modes; avoidance of highways, bridges, tunnels; remaining in a familiar, predictable environment; asking for social support when travel is necessary; and searching for adequate travel information to use before and during travel.
Coping with anxiety disorders and mobility-related problems impacts on professional life, including job switching and job relocation. It is almost impossible to develop a ‘one-size-fits-all’ approach to alleviate this population’s problems. We end with transport interventions that could benefit people with anxiety disorders.
This study brings to light some of the hidden barriers to mobility that are experienced by people with anxiety disorders. It adds to the literature on barriers experienced by people with physical and sensory impairments.
There is an expectation that everyone will be self-reliant and keep up with the latest technology. But what happens to people who don’t keep up or can’t? Digital technologies have quickly found their way into pubic transport systems. But the digitisation of public transport can lead to unequal access.
We need to broaden the conversation from accessibility to inclusion. It has to go beyond people with mobility and sensory impairment captured by access standards. The digital divide is too complicated to be addressed by a single solution.
According to recent research, there are multiple groups of individuals who are likely to be impacted by the digitisation of public transport. If individuals experience difficulty or can’t get support, they may stop using public transport altogether. But it is these groups that often rely on public transport the most. So, what can be done to mitigate this?
A team of researchers in the Netherland set about finding some answers. Their study found more than one answer was needed, and that they needed to complement each other. They uncovered fourteen measures, categorised into five perspectives. Briefly they are:
Design – strive for universal design
Educational- provide courses
Persuasive – raise awareness
Social – provide non-digital alternatives
Governance – adopt a long term approach
The research paper explains these five perspectives in more detail using the fourteen different measures. Not all measures need to be enacted by all stakeholders in the transport system. Clearly, it depends on what part of the system people are working in. However, universal design is the underpinning perspective.
A focus on an inclusive design from the start showing the added value of digital products and services is needed. In addition, providing courses, specialist products and non-digital alternatives contribute to fostering a more inclusive public transport system. The role of public transport staff ought not to be underestimated by public transport authorities. Workers at the interface between the system and users play a key role in the digital transition.
Last but not least is the governance of digitalisation in the sector to mitigate unequal access. Nevertheless, there is only so much that the transport sector can do. Tackling systemic issues that underlie digital barriers like poverty and low literacy is crucially relevant.
From the abstract
Digitalisation is making its way into public transport (PT) services. Policy approaches to ensure that such services remain inclusive are at best fragmented, at worst non-existent. This study looks existing initiatives and lessons learnt in the transport sector, and takes inspiration from other fields with a more mature understanding of digitalisation.
Twenty-two experts working either in the PT sector or in other sectors such as healthcare and public administration were interviewed. We conclude that there is no one-size-fits-all, but a series of complementary strategies to address digital inequality.
A focus on an inclusive design, specialist products and non-digital alternatives are the basis of a more inclusive PT system in the era of digitisation.
The role of the public transport staff is essential in digital transformations. Acknowledging the issue of unequal access to PT due to digitalisation at a decision-making level is essential.
While the present study was conducted in the Netherlands, the presented measures can be applied in other countries by stakeholders working on inclusive digital transformations in (public) transport services.
 The policy push to encourage people to walk and use public transport is one way to reduce emissions and improve health. However, whether to choose the car or public transport, or not to go out at all, depends on many factors. So, do people choose the car because they are constrained from using other forms of transport? Or do they use the car because it just suits them better?